Sri Lanka's Fertility Rate: Children per Woman
In 2023, the fertility rate was 1.97 births per woman, reflecting a historical decline influenced by family planning initiatives.
At the intersection of institutional communications, data storytelling, and information design. I learn by doing, and enjoy sharing what I've created!
Selected Work
Global Reach
A look at the countries my work has reached.
About
I am a communications officer who works at the intersection of institutional communications, data storytelling, and information design. Outside of client work, I'm probably deep into video games, out on a run, or making something just because I felt like it (a few of those live on my notes page). I learn by doing, and that curiosity drives my professional work too.
Good communication isn't just about making things look nice. It's about making sure the right message reaches the right person. Sometimes that's a report. Sometimes it's an interactive data story for a public audience that has never read a policy brief. The work changes, but the core question stays the same: who needs to understand this, and what do they actually need to see? Most people think being informed means keeping up with what's broken: the war, the crisis, the day's headline. That's real, but it isn't the whole picture, and it rarely tells you how anything actually works. Understanding how a policy affects you, how a budget gets spent, or how a system is supposed to function takes a different kind of communication, one built to explain rather than alarm. That's the gap I work in.
Organisations frequently invest significant resources in thorough research and detailed analysis, yet they often stumble at the final step: communication. When this becomes an afterthought, people misunderstand the findings, ignore them, or they never reach the people meant to act on them. That's where I step in, turning finished analysis into something the intended audience will actually read, understand and use. I've done this for research institutes, government departments and development organisations, in Sri Lanka and abroad.
It started in 2020, when I produced campaign content for United Nations Volunteers Sri Lanka during COVID-19 as part of the TogetherAtHome campaign, before I'd call any of this a career. There's a short recap video from that week, if you're curious about where it all started.
Strategic Communications
Information Design & Data Storytelling
Publications & Visual Communication
Digital Engagement & Experiences
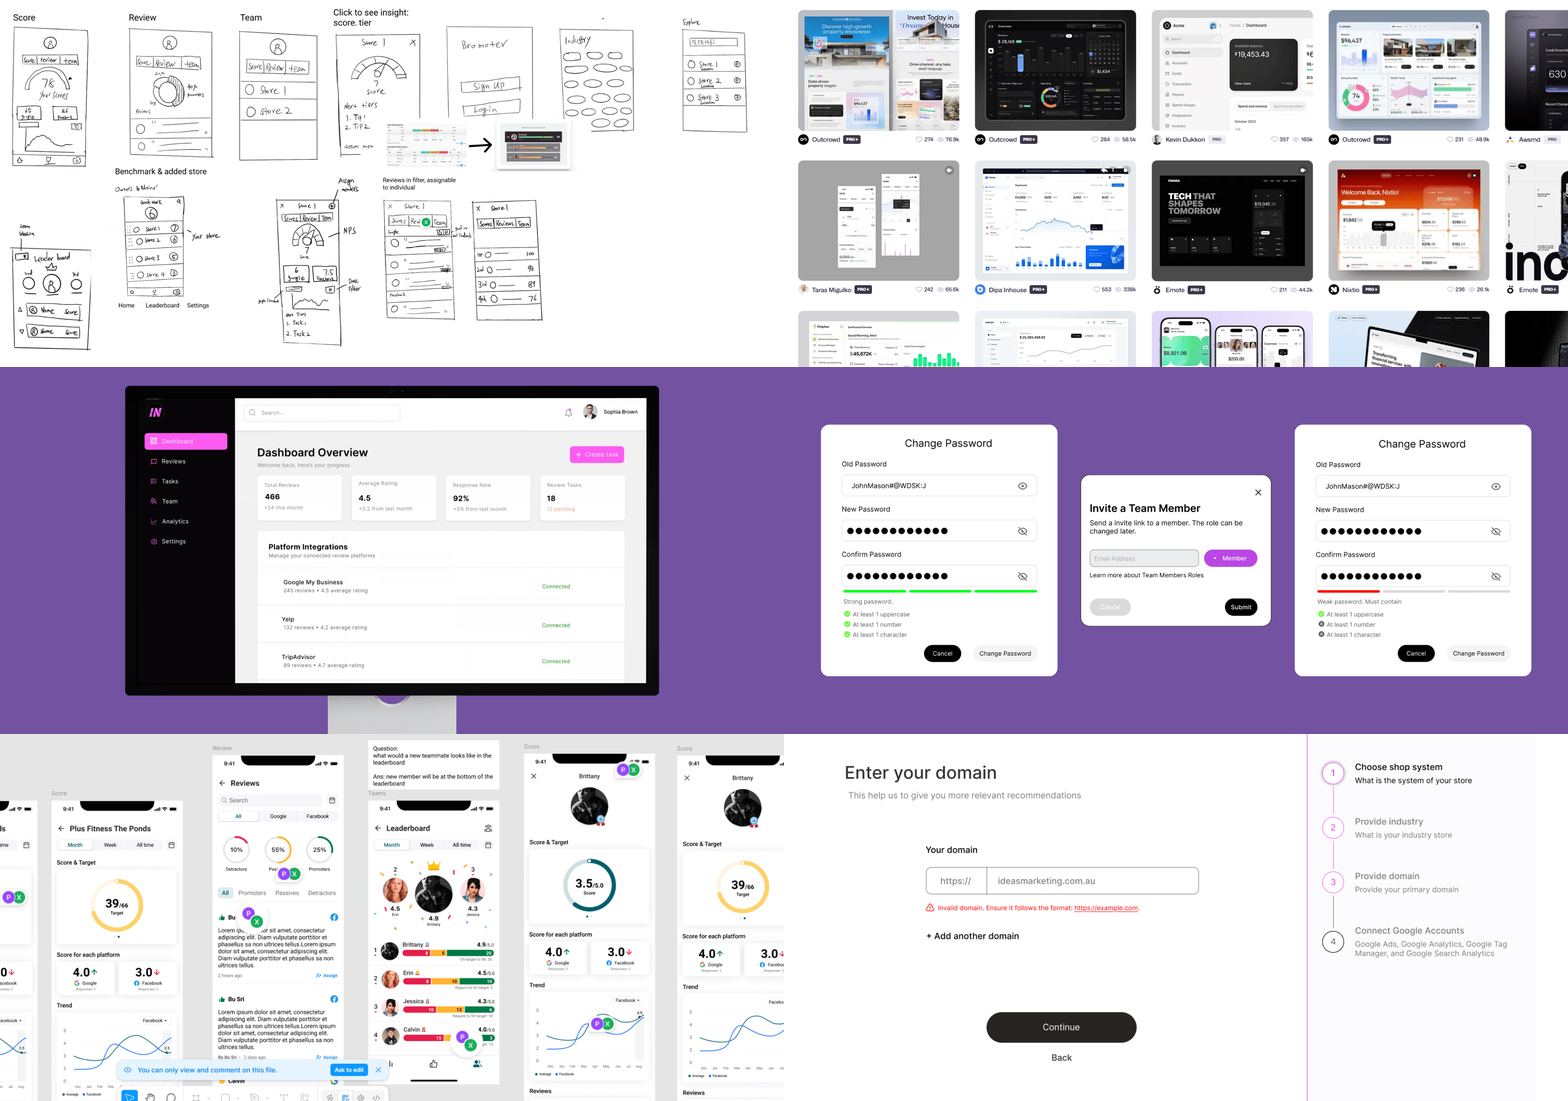
More campaign and print work in this project archive ↗, plus social and video editing work ↗.
What I Do
Every project is scoped and quoted to its brief, so you only pay for what you need. Each service lists what it includes. Send a short brief and I will reply with a figure and a timeline.
Download Services GuideInteractive stories, infographics and maps that make national data readable for people who would never open the spreadsheet.
Includes data cleaning and 2 revisions, delivered in 3 to 5 days. Complex datasets and interactive web stories are scoped separately.
Layouts that help a senior reader find the point quickly, and that still look like the institution behind them.
Includes charts, 2 revisions and a print-ready, accessible PDF. Heavy data or custom illustration is scoped separately.
Visual identities that keep a campaign, event or organisation looking consistent across every output.
Includes a logo (2 concepts), colours, fonts, a one-page style guide and 2 revisions. Full brand systems are scoped separately.
The steady, day-to-day work of keeping an organisation visible, so its audience hears from it regularly.
Includes 12 designed posts with captions, a content calendar and 2 revisions per post. Press, video and larger volumes are quoted separately.
Websites and newsletters that stay current and are shaped around how people actually use them.
Includes up to 4 page updates, 1 newsletter and 2 revisions. Redesigns and larger sites are quoted separately.
Writing
Notes on my decisions during the work: what I tried, what failed, and why the results turned out as they did.

Six iterations of a teardrop, a hero image that changed twice, and why pulling back at the end was the hardest call I made on the whole project.
Read on Medium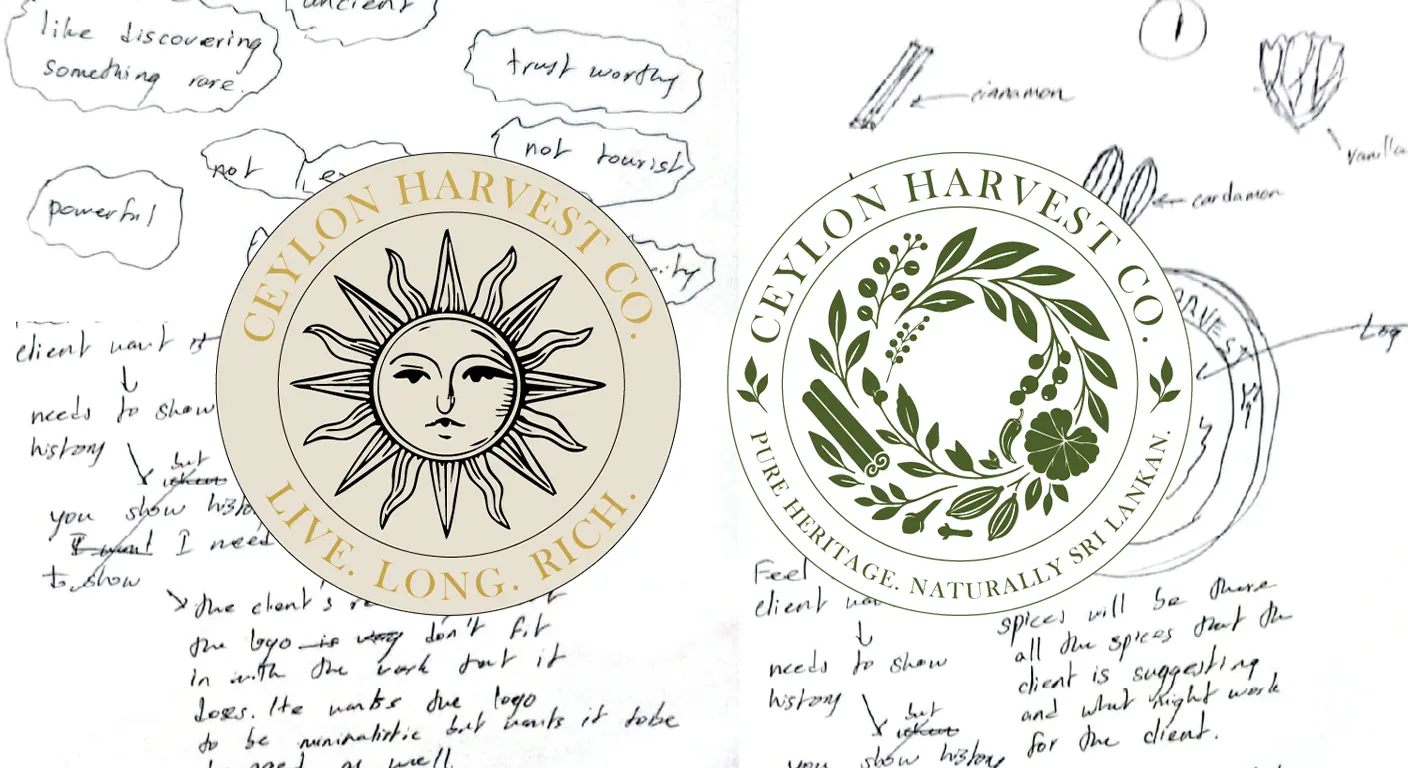
Building a premium Sri Lankan export identity. The client needed a brand that felt ancient, classic, and rooted in heritage, entirely avoiding generic tourism tropes.
Read on MediumData Storytelling
Charts built to answer one question each, on topics from fertility and government budgets to drug policy.
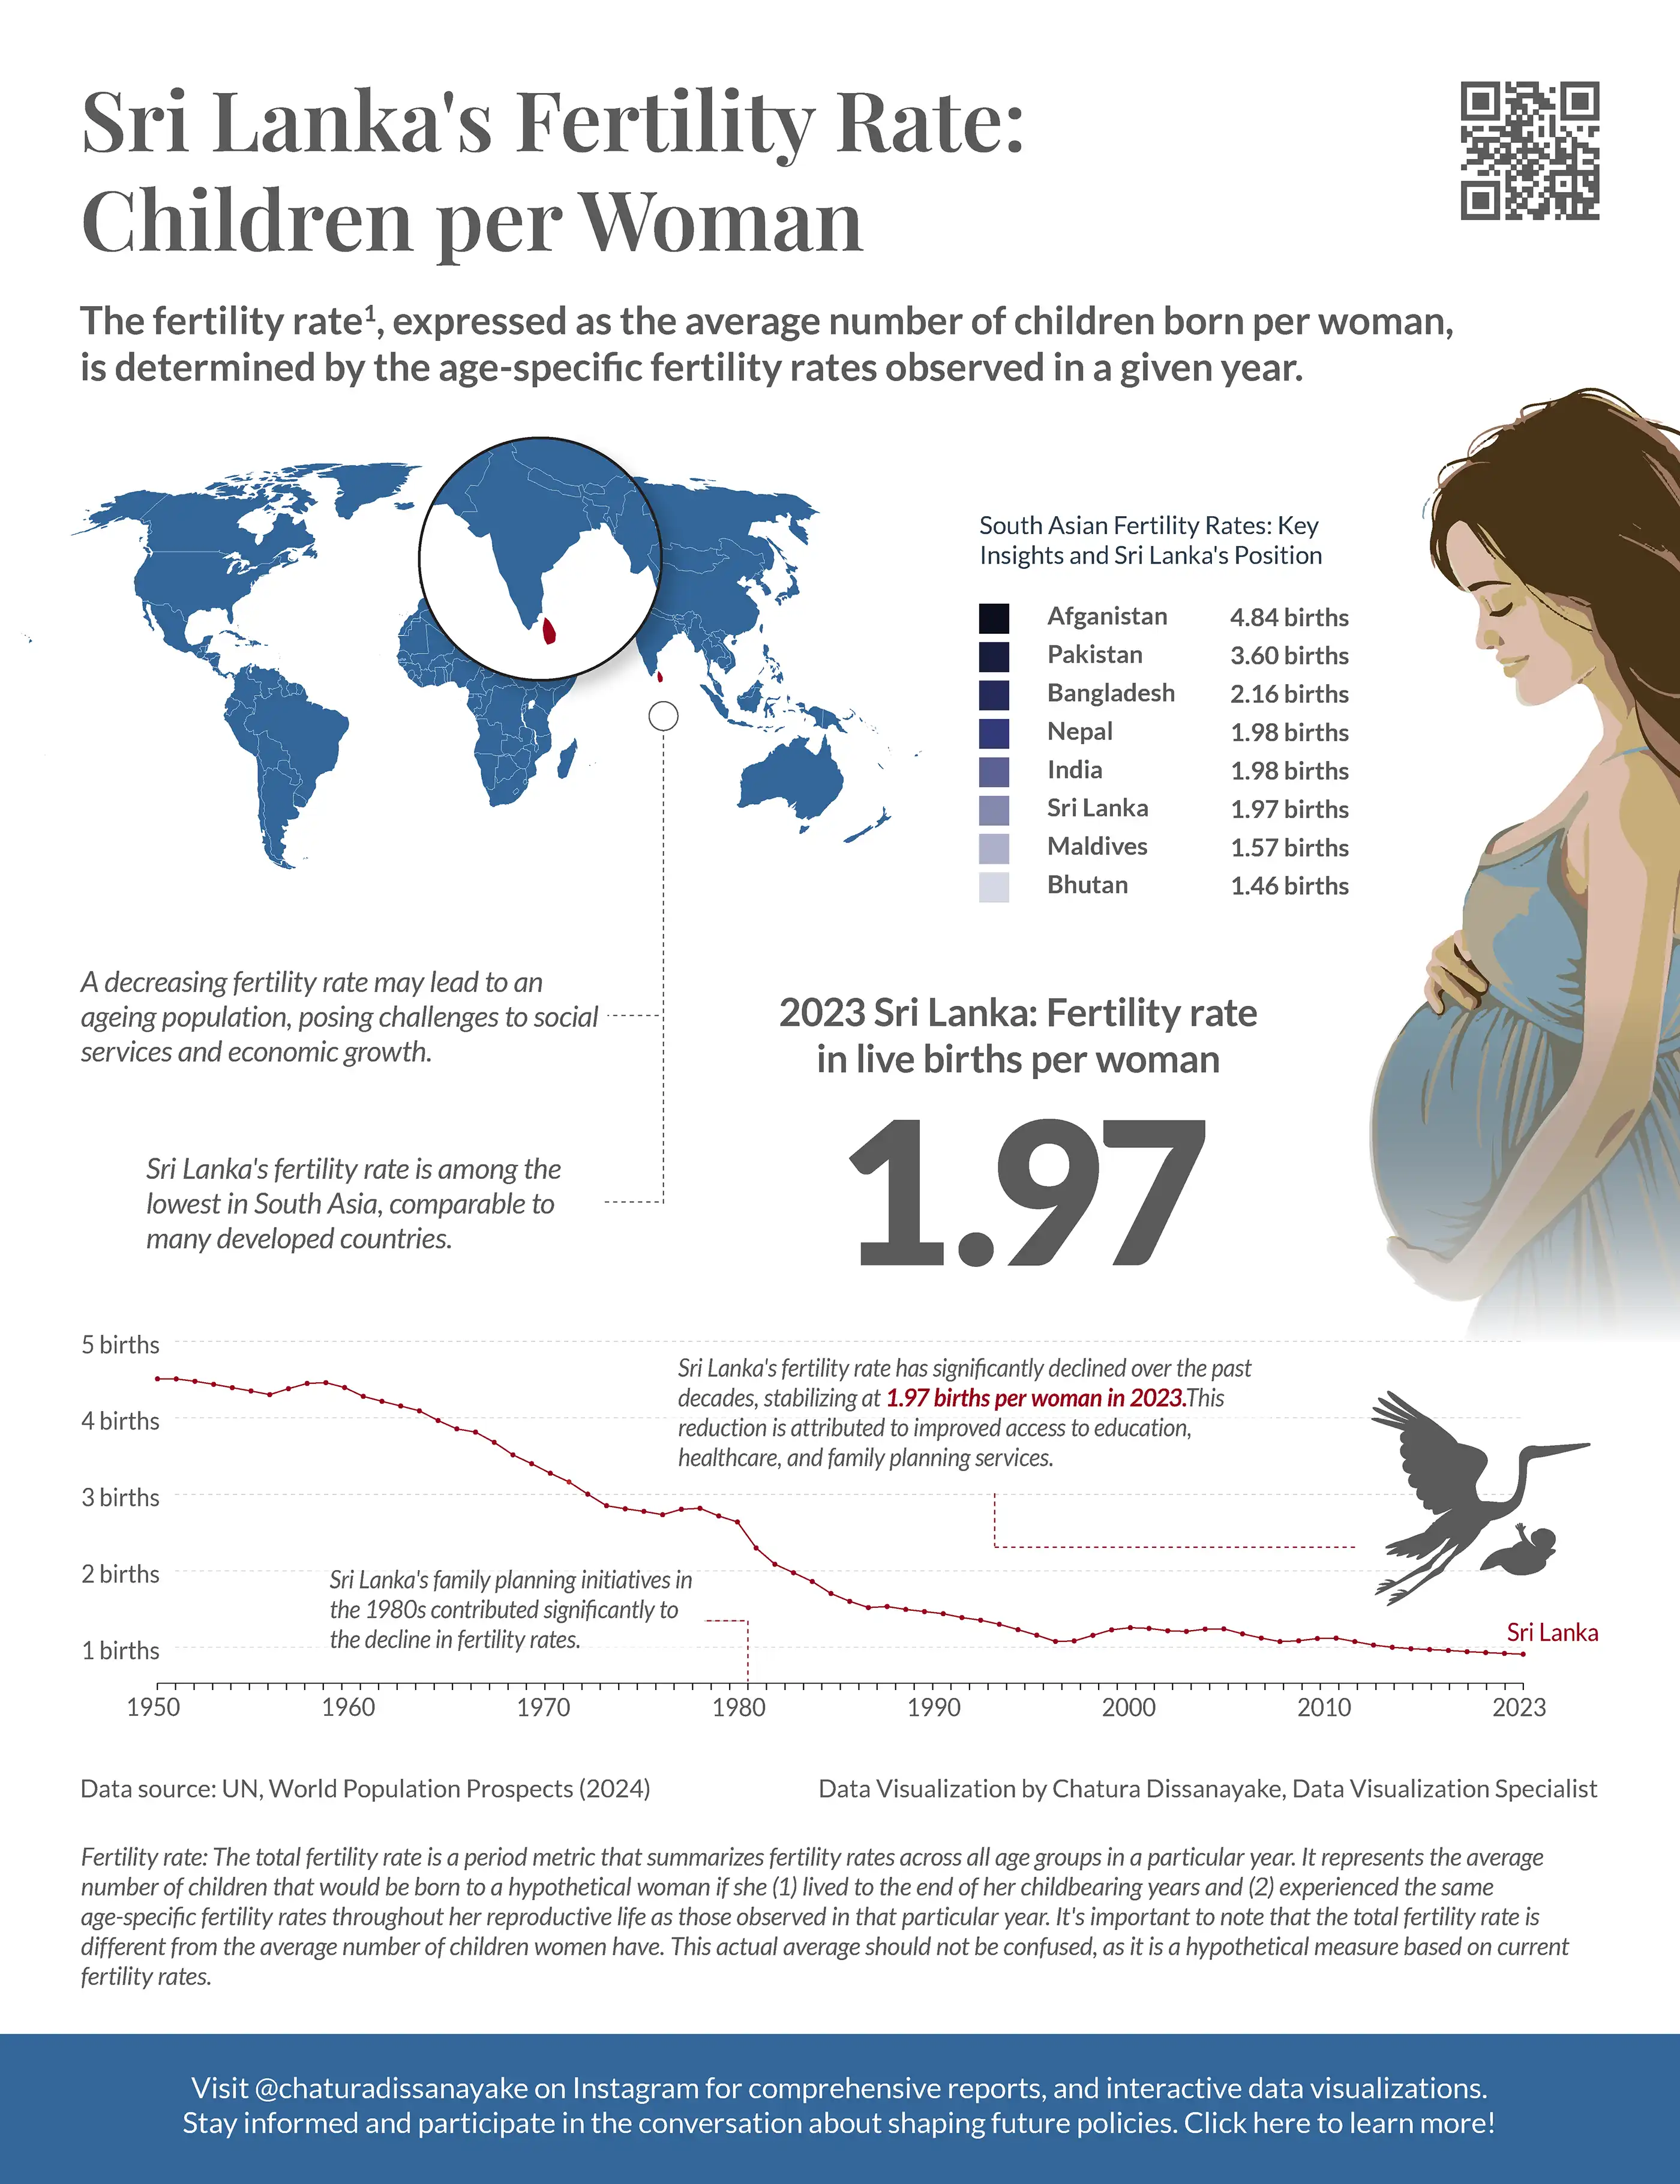
In 2023, the fertility rate was 1.97 births per woman, reflecting a historical decline influenced by family planning initiatives.
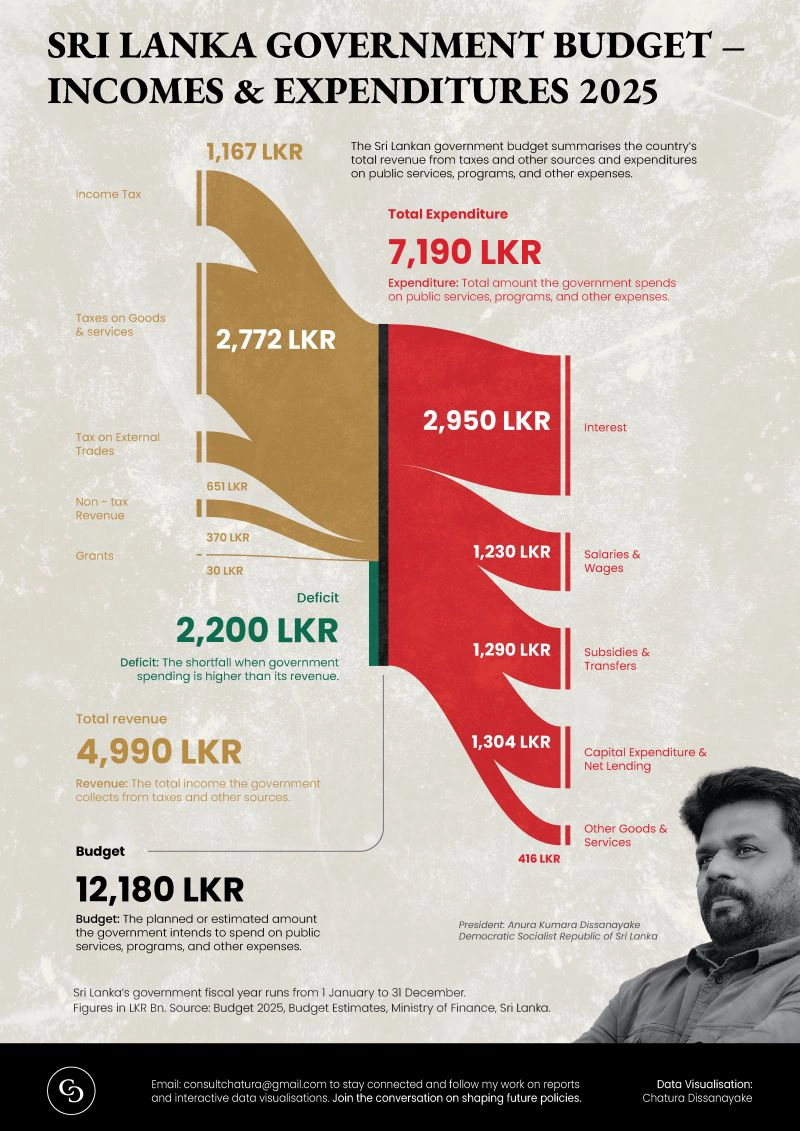
Where the money comes from, and where it goes. The Sri Lankan government budget made legible in one view.
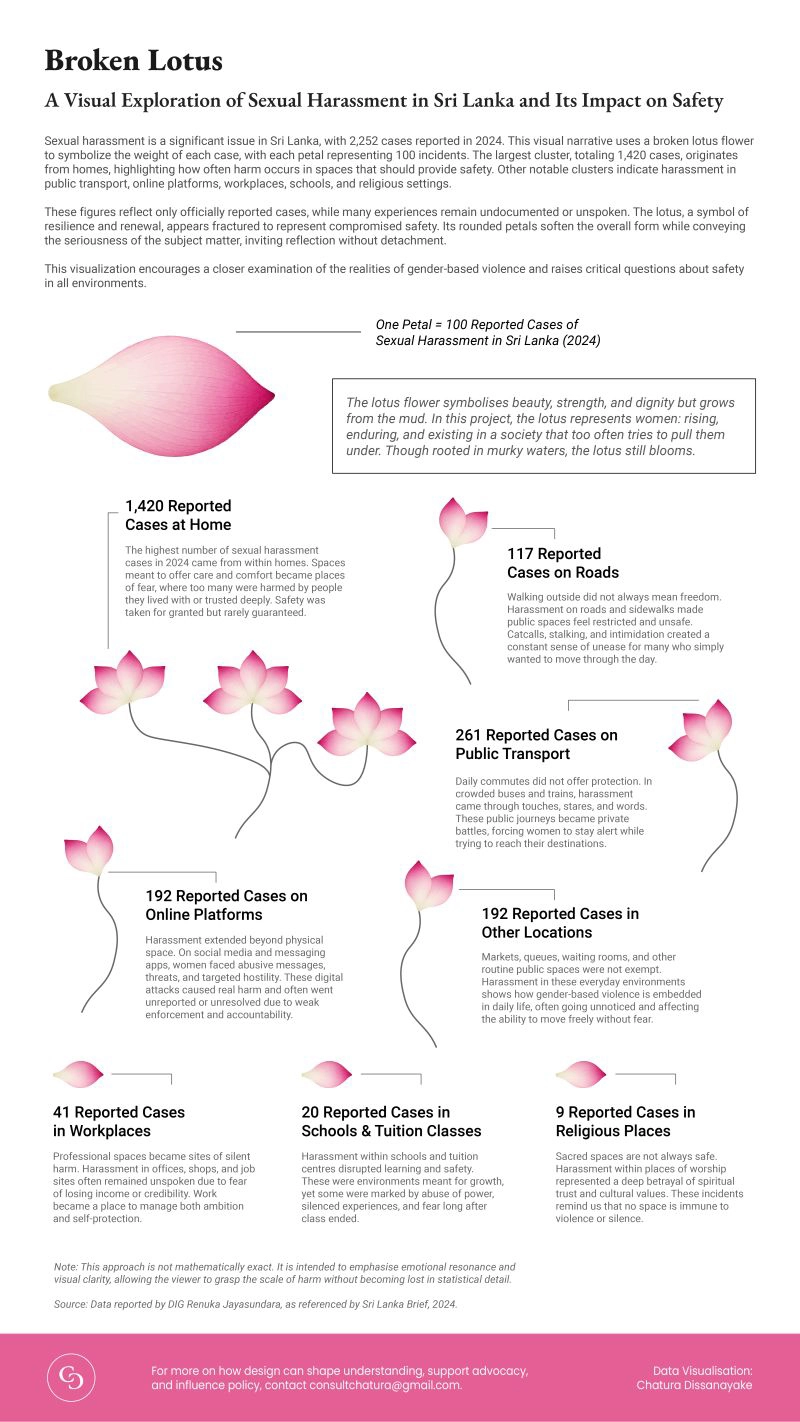
2,252 reported cases. Each petal is 100. A broken lotus, because some numbers deserve more than a bar chart.
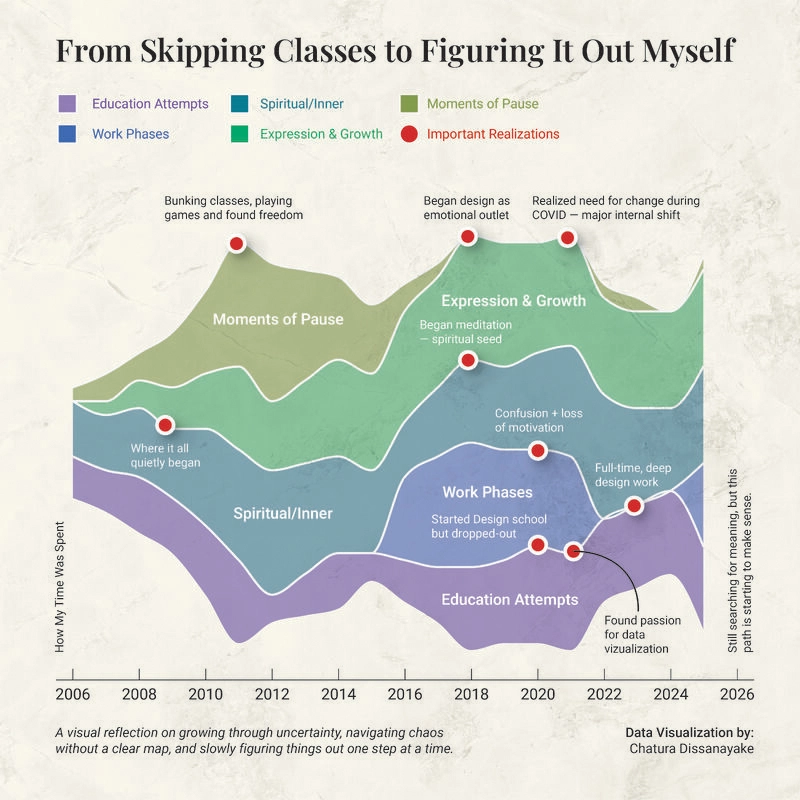
A personal piece. On navigating uncertainty without a map, and what it looks like to slowly find your footing.
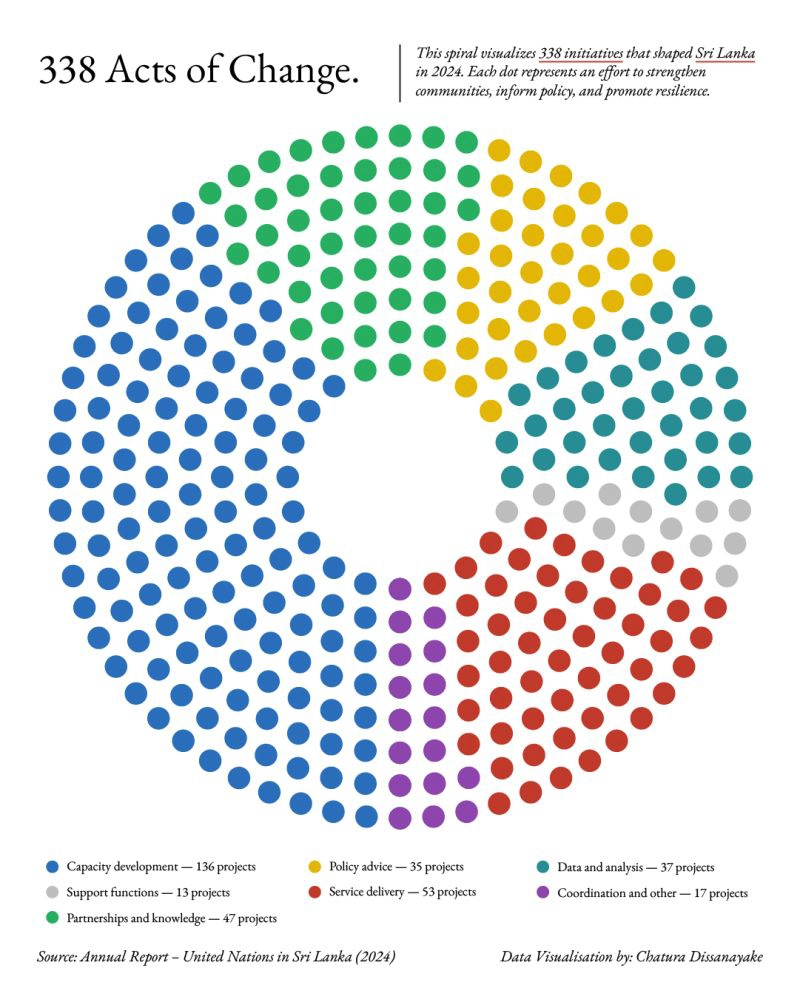
338 initiatives that shaped Sri Lanka in 2024. Each dot is one effort to strengthen communities or inform policy, visualised as a spiral.
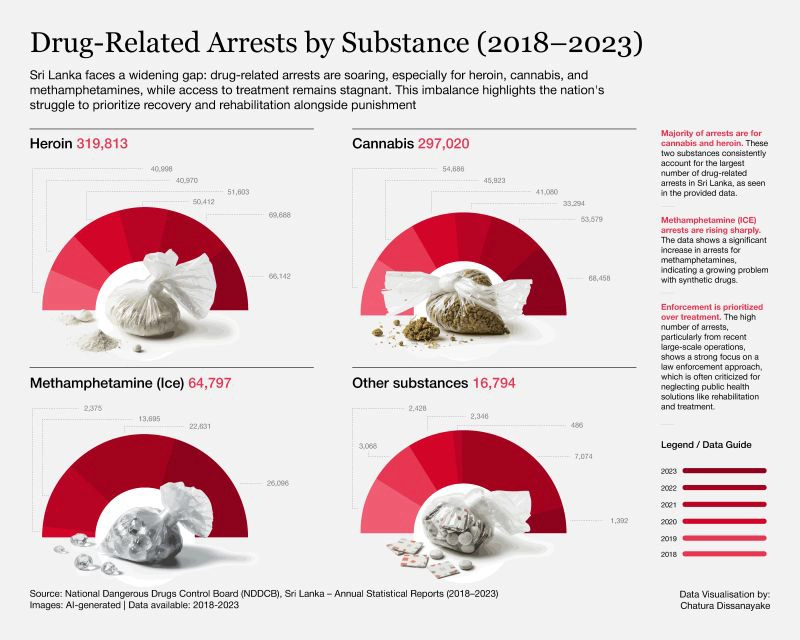
Heroin, cannabis, methamphetamines, all rising. The breakdown behind Sri Lanka's drug enforcement picture.
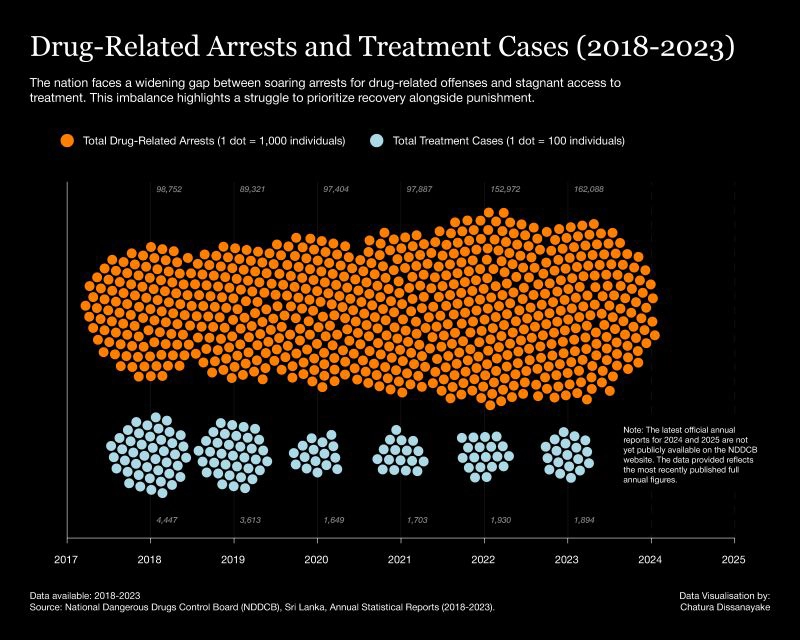
Arrests climbing. Treatment access flat. The widening gap between punishment and care, in one chart.
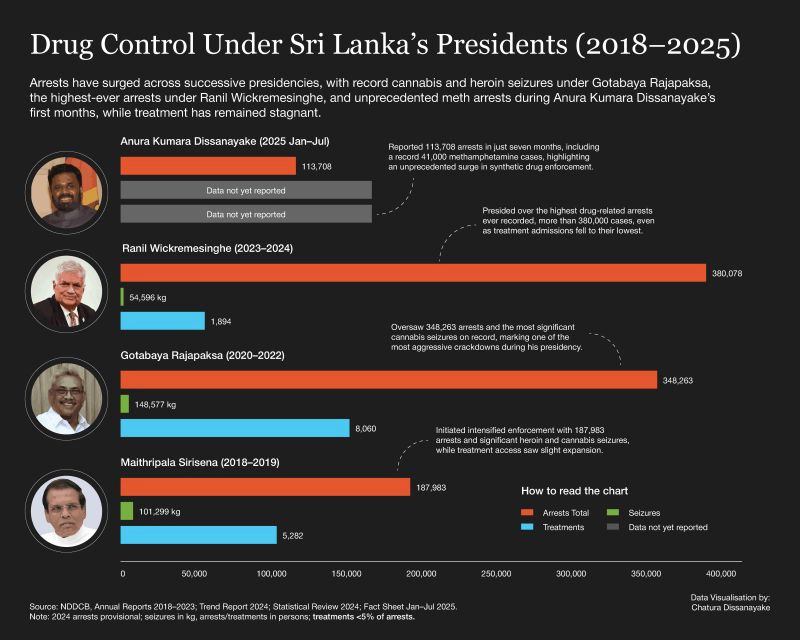
Arrests have climbed across every presidency. Record cannabis and heroin seizures under Gotabaya Rajapaksa.
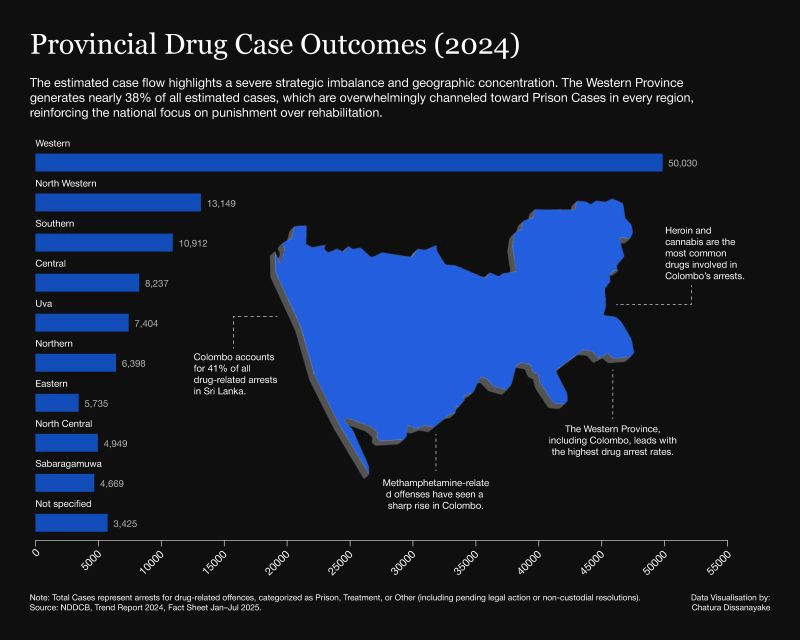
Case flow by province, and what it reveals about a system still built around punishment more than rehabilitation.
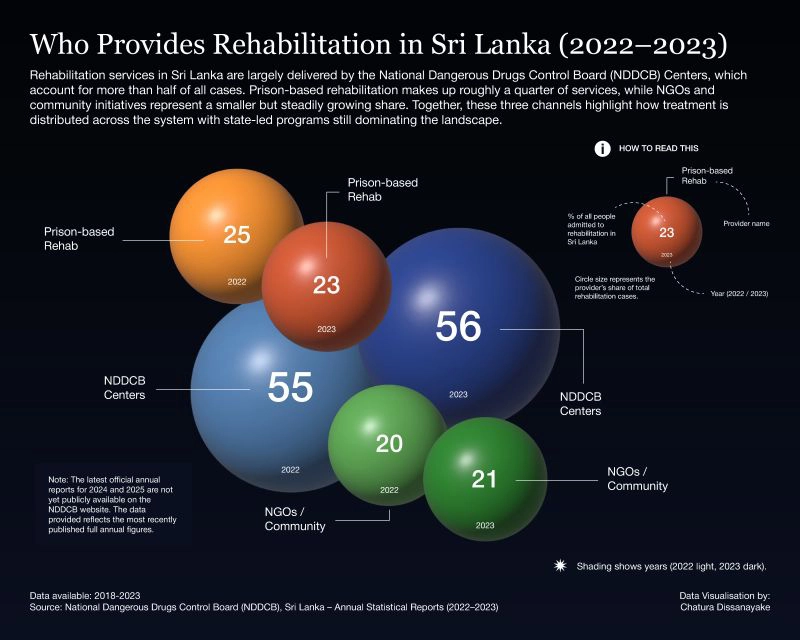
NDDCB Centres handle more than half of all rehabilitation cases. A look at who's doing the work, and who isn't.
Featured Clients








Reception
A line from my most recent formal review, and an unprompted note from someone who came across the work.
Chatura showed great dedication and delivered quality work within a limited timeframe. He was a reliable team member who remained professional, flexible, and supportive throughout.
I checked your work on Medium, “I Built a Data Story About Cyclone Ditwah.” It’s super impressive, great work.
Get In Touch
If you're working through data, an upcoming report, or want to think out loud about how your organisation communicates, I'm open to that conversation. The best projects I've worked on started with a problem, not a finished product.
For project inquiries, consulting requests, and collaborations.
consultchatura@gmail.com SL
SL MK
MK